How to Check the Daily Process Log in WHM?
Introduction
An online business can be affected by server connectivity issues or slow site performance. The Daily Process Log will indicate precisely what is leading to the delays. You can view this log on a daily basis to determine who is using the most resources, as well as which scripts are using the most resources.
What is the Daily Process Log?
The Daily Process Log documents all the server activity over a complete 24-hour duration, including memory and CPU utilization by each account. Diagnose spikes in performance and have a clear picture of the server health for any specific date you choose.
Steps to Access the Daily Process Log
These logs are directly available in your WHM. Use the following steps to verify your server statistics.
- Open your WHM and fill in your root login information.
- Locate the Server Status menu on the left-hand navigation menu.
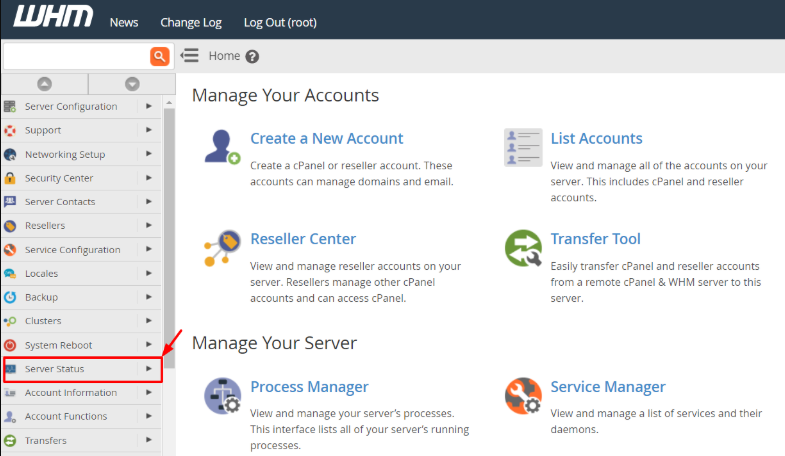
- Select the Daily Process Log link, and the main report page will open.
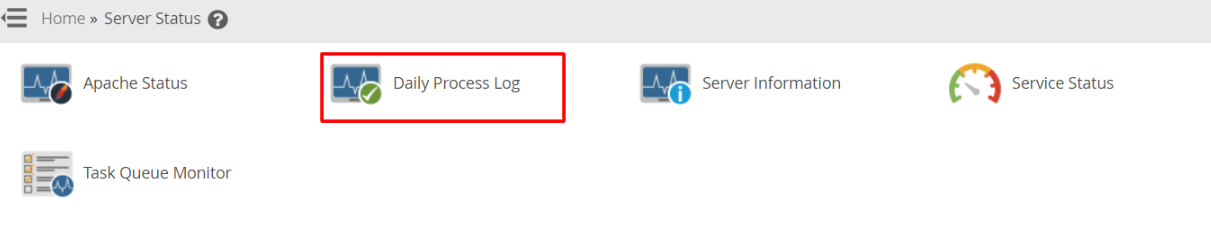
- Select a particular date you would like to check out of the list.
- Examine the tables to identify the accounts that utilized the highest number of resources.
Understanding the Log Tables
The Log Tables represent the most common values from the logarithmic scale.
The information is split into two tables on the log page so that it can be easily read. All the tables provide you with varying information about the server load.
Account Resource Usage – Table 1 displays the CPU and memory percentage of each site, and the table displays the average number of MySQL processes per user.
Top Processes Table – The second table lists the specific tasks that the server runs. It shows the names of the processes and the amount of CPU power they consume.
Conclusion
Daily Process Log is a very essential tool for any server administrator. It assists in locating accounts that are resource-intensive before they can lead to a complete server crash. It is always good to check these logs on a regular basis so that all your visitors on the site have a good experience.
FAQs
Why is my CPU usage showing a very high percentage?
When a percentage is high, a particular script or website is straining, generally in high traffic or because of poorly written code.
Is it possible to see the last month’s logs?
WHM usually retains logs for a short period of days. Check the logs on a weekly basis to keep a record of your server performance.
What is the MySQL process count?
This figure indicates the number of database queries an individual runs on average. High figures may mean that a site has high database traffic.
Should I notify support in case of an odd process?
Yes, provide the name of the process to the Cantech support team. We shall confirm whether it is a safe process or a possible security risk.
Does the process of checking these logs slow down my server?
No. This will not write any new data files to the disk, nor will it impose any additional load on your active server processes.
Related: How to get raw FTP logs from the WHM panel?
Related: How to Search for Files in System Logs of CSF via WHM?