Learn to view and filter logs in Plesk
The first step to efficient server management is visibility. It doesn’t matter if you’re dealing with a 500 Internal Server Error, a security breach, or simply want to track how many visitors you’ve got, the first place to start is the Plesk Log Viewer. Plesk lets you view and diagnose issues without having to go to the command line since you can manage and monitor logs from Apache, Nginx, PHP, and even your custom applications all from one place. In this tutorial, we’ll go over the different logs that are available to you and how to use Plesk’s filtering options to find logs that interest you most.
# Steps to access the Plesk Control Panel
1. Login to the Customer Portal.
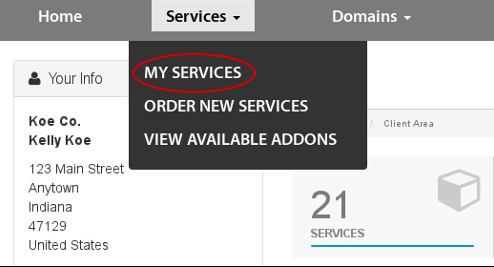
2. Click the Services menu and choose MY SERVICES:
3. To the right of the desired hosting package, click Manage.
4. On the Hosting Information tab, click Open Control Panel.
# You can view the logs by following the steps below:
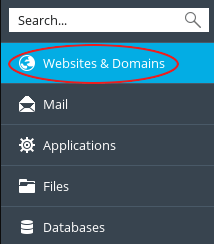
1. Go to the left sidebar of the Plesk panel and click on `Websites & Domains`.
2. If you have multiple domains on the server, please scroll to the management area for the domain and click on `Logs`.

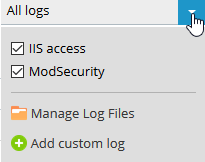
3. By default, Plesk shows all of the logs. Logs available to you depend on the platform.
The ModSecurity and IIS access logs for Windows are shown here.
# Steps to filter Logs
You can filter logs based on Date, visitor IP address, HTTP status code, or HTTP message.

1. To filter logs by Date, click on the down arrow on the right side of the Form field. You will be able to use date and time controls to choose the oldest date you wish to appear in your results. When you are finished, click Apply.
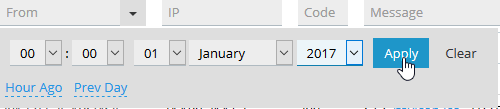
The entries from 2017 onwards will be visible in the example above. If you wish to eliminate the data filtering, click on the Clear button.
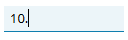
2. To filter logs by visitor IP address, input the entire IP address or a portion of it in the IP text box. If you enter a partial IP address, it will log an entry that shows results if any portion of the IP address corresponds with the entry. In the example below, 10. corresponds with 10.1.1.1. and 192.168.210.1.
3. To filter logs by HTTPS status code, you enter the entire status code or a portion of it in the text box. When you enter a part of the code, log entries are displayed based on the status code match. In the example below, 5 corresponds to all the 5xx Server Error Codes, and it also corresponds to 505 and 605.

4. To filter logs by messages, you can enter one or more words in the Message text box. If any logs match the text you entered, those logs will be displayed. In the example shown below, the word POST, followed by a space and a forward slash, allows for filtering to only those logs that are POST messages. If the space and forward slash are omitted, the result will show all logs that include the word post.

Note: Creating combinations of these filters helps achieve the desired result.
# How to view the most recent data
There are two ways to view the most recent data on the Logs page:
1. To keep the view updating in real time, allowing for the newest visitors to enter the site at any time, click Start real-time updates at the top left of the Logs page. The button changes to Stop real-time updates to indicate that real-time updates are currently on. To end real-time updates, click Stop real-time updates.
2. Click on Refresh to update the logs and view the most recent data while pausing the real-time updates.
Conclusion
In Plesk, log management tools turn guessing into knowing. Logs help you identify and troubleshoot technical issues, even logs, and documents are only useful if retained. Review your Logs Rotation settings to find a balance between your storage and your historical data requirements. You can now use these techniques and filters to help you keep your digital space as sanitized and secure as ever.
