10 tools to Monitor Linux Server Resource Usage and Statistics
Introduction
Maintaining a Linux server’s performance requires continuous resource usage and statistics monitoring. Resources here mean memory, CPU, disk, network usage, etc. You must consider these aspects to ensure your server runs smoothly.
So, Linux monitoring tools can give you valuable insights into your server activities. With linux server resource monitoring, you get important information such as processes using the most CPU or memory availability.
Monitoring tools can help you spot any problems early. You can keep a Linux server healthy and efficient with the essential tools discussed in this article.
Prerequisites
You need a properly set up Linux server. So, first, deploy a Linux server on Cantech or any other cloud service to test monitoring tools. Log in using SSH, as your server is up and running. You must use a non-root user with sudo privileges for security reasons. Next, update your system so that all the required tools can be installed without any issues.
What is Linux server monitoring?
Linux server monitoring is the process of tracking system resources such as CPU usage, memory consumption, disk activity, and network performance to ensure optimal server health and performance.
Checking GPU Usage with NVIDIA-SMI
For a Linux server running on a GPU, you must monitor its usage for better performance. NVIDIA provides a command-line tool called nvidia-smi that helps track GPU activity. It comes together with NVIDIA drivers, and you can check VRAM usage and GPU load using it.
Below are the different commands for various purposes.
- Use the
nvidia-smicommand to check GPU usage on your server.
nvidia-smi
- Make this more dynamic with the
watchcommand. It refreshes the data every few seconds to track real-time usage. For example, the below command will refresh the output every5seconds; you need not re-enter the command. To stop the process, pressCtrl+C.
watch -n 5 nvidia-smi
The official NVIDIA documentation can give you additional options and configurations.
Checking Disk Space with the DF Command
Monitoring disk usage ensures prevention and solutions for storage-related problems. Linux has a built-in tool called df that helps you to track the availability and usage of disk space on different storage devices on your server.
Below are different commands in df –
- Check your server’s current disk space and storage with the below command.
df
It tells you the storage device name in the Filesystem section. For instance, the main server storage is often listed as /dev/vda2, while the boot volume appears as /dev/vda1. Other volumes like /dev/vda3 or /dev/vda4 may be secondary partitions or external storage.
The command also shows the storage size in 1-kilobyte blocks under 1K-blocks. The Type section displays the filesystem format. Size shows the total space of the storage in MB or GB, and Used shows how much space is already used.
It also tells you how much space is still available under Available. Use% shows the percentage of space used. Finally, Mounted on shows where the volume is mounted in the system, like / for the root directory.
However, the default output is in kilobytes (it is difficult to read).
Filesystem     1K-blocks    Used Available Use% Mounted on
udev             1984768       0   1984768   0% /dev
tmpfs             402020    1152    400868   1% /run
/dev/vda2       30546940 2836428  26184960  10% /
tmpfs            2010096       0   2010096   0% /dev/shm
tmpfs               5120       4      5116   1% /run/lock
tmpfs            2010096       0   2010096   0% /sys/fs/cgroup
/dev/vda1         106858    5300    101558   5% /boot/efi
tmpfs             402020       0    402020   0% /run/user/1000
- Make the output more readable using the
-hflag. This command displays disk space in KB, GB or MB, which is easier to understand.
df -h
Output:
Filesystem      Size  Used Avail Use% Mounted on
udev            1.9G     0  1.9G   0% /dev
tmpfs           393M  1.2M  392M   1% /run
/dev/vda2        30G  2.8G   25G  10% /
tmpfs           2.0G     0  2.0G   0% /dev/shm
tmpfs           5.0M  4.0K  5.0M   1% /run/lock
tmpfs           2.0G     0  2.0G   0% /sys/fs/cgroup
/dev/vda1       104M  5.2M   99M   5% /boot/efi
tmpfs           393M     0  393M   0% /run/user/1000
- Check a specific storage volume and specify the filesystem path for that. For example, check /dev/vda1 with –
df -Th /dev/vda1
Output:
Filesystem     Type  Size  Used Avail Use% Mounted on
/dev/vda1      vfat  104M  5.2M   99M   5% /boot/efi
- Access the manual page for more details :
man df
Checking Memory Usage with Free Command
A Linux server relies on RAM and swap memory for smooth operation. The free command helps you track memory usage in real time. It comes with the default procps utilities package.
Below are the commands for different purposes –
1. Check memory details (The output includes used memory, free memory, and buffer/cache details).)
free
Output:
              total        used        free      shared  buff/cache   available
Mem:        3920904     1123456      856732      145632     1940716     2501232
Swap:       2097148           0     2097148
Change the memory measurement value with options like:
-b: Bytes-k: Kibibytes-m: Mebibytes-g: Gibibytes--kilo: Kilobytes--mega: Megabytes--giga: Gigabytes
2. See memory usage in MB instead of kilobytes with the -h option.
free -h
Output:
               total        used        free      shared  buff/cache   available
Mem:           3.7Gi       1.1Gi       837Mi       142Mi       1.9Gi       2.4Gi
Swap:          2.0Gi          0B       2.0Gi
The output includes:
Total= Total available memory.Used= Amount of memory currently in use.Free= Memory that is completely free.Available= Memory that can still be used by applications without affecting performance.Swap= Swap memory, used when RAM is full.
3. Monitor memory usage continuously by running the below. This updates the memory details every 3 seconds.
watch -n 3 free -h
4. Check swap memory details.
swapon
Output:
NAME      TYPE      SIZE   USED PRIO
/swapfile file      2G       0B   -2
5. Read the manual for more information.
man free
Monitoring System Processes with Top Command
The top command is an essential tool for tracking server processes, CPU usage, and memory consumption in real time. It provides detailed insights into how the server is handling resources.
Below are the Commands for specific purposes.
1. Start the top interface.
top
Output:
top - 11:27:03 up  5 days,  2:31,  2 users,  load average: 0.45, 0.37, 0.25
Tasks: 210 total,   1 running, 209 sleeping,   0 stopped,   0 zombie
%Cpu(s):  4.5 us,  1.2 sy,  0.0 ni, 93.8 id,  0.3 wa,  0.0 hi,  0.2 si,  0.0 st
MiB Mem :  15927.3 total,   2095.6 free,   6453.8 used,   7377.9 buff/cache
MiB Swap:   2048.0 total,   2047.5 free,      0.5 used.   8250.1 avail Mem

  PID USER      PR  NI    VIRT    RES    SHR S  %CPU %MEM     TIME+ COMMAND
 1356 root      20   0  545812  74728  31208 S   5.3  0.5   0:12.34 Xorg
 2781 user      20   0 1574820 122348  62412 S   4.7  0.8   1:05.92 gnome-shell
 4123 mysql     20   0 2456128 561284  43208 S   3.1  3.4   5:43.21 mysqld
 2987 www-data  20   0  764512  45328  13284 S   2.4  0.3   0:34.76 apache2
 2988 www-data  20   0  763248  44120  13012 S   1.9  0.3   0:29.15 apache2
 2950 www-data  20   0  761984  43896  12900 S   1.6  0.3   0:27.44 apache2
    1 root      20   0  169472   9120   6520 S   0.0  0.1   0:03.11 systemd
This will display a dynamic list of active processes. The output includes:
System Information: uptime, logged-in users, and system load averages.CPU Usage: percentage of CPU used by different tasks.Memory Usage: RAM and swap memory usage.Processes List: details like process ID (PID), CPU usage (%CPU), memory consumption (%MEM), and thecommandrunning the process.
Close the top interface by pressing Q.
2. See processes from a specific user using the -u option, followed by the username.
top -u linuxuser
Output:
top - 14:32:18 up  7 days,  3:15,  2 users,  load average: 0.35, 0.42, 0.38
Tasks:  45 total,   1 running,  44 sleeping,   0 stopped,   0 zombie
%Cpu(s):  3.7 us,  1.1 sy,  0.0 ni, 94.8 id,  0.3 wa,  0.0 hi,  0.1 si,  0.0 st
MiB Mem :  15927.3 total,   2010.2 free,   6390.7 used,   7526.4 buff/cache
MiB Swap:   2048.0 total,   2047.2 free,      0.8 used.   8241.6 avail Mem

  PID USER       PR  NI    VIRT    RES    SHR S  %CPU %MEM     TIME+ COMMAND
 3124 linuxuser  20   0  783452  45324  17832 R   4.1  0.3   0:12.89 top
 3628 linuxuser  20   0  435280  24216   8320 S   1.9  0.1   0:03.77 bash
3. End a process by pressing k, typing the Process ID, and confirming with Enter.
4. If you want more details, check the manual.
man top
Using VMStat for Detailed Performance Monitoring
The vmstat command helps track CPU, memory, and disk activity. It provides a detailed breakdown of how your server manages resources. It is a great tool for checking overall performance.
1. Check system statistics.
vmstat
Output:
procs -----------memory---------- ---swap-- -----io---- -system-- ------cpu-----
 r  b   swpd   free   buff  cache   si   so    bi    bo   in   cs us sy id wa st
 1  0      0 400000  25000 1500000   0    0     2     1  120  220  2  1 97  0  0
The output includes details about:
- Processes (procs): number of running and blocked processes.
- Memory Usage: free, used, and cached memory.
- Swap Memory: swap memory usage.
- Disk I/O (io): number of blocks read and written to storage.
- CPU: CPU usage is the percentage of time spent on different CPU tasks.
2. Get continuous updates every 2 seconds.
vmstat 2
3. Generate a fixed number of reports (E.g. 10)
vmstat 2 10
4. See a memory and CPU usage summary.
vmstat -s
Output:
16316032 K total memory
 398520 K free memory
1502456 K used memory
 24800 K buffer memory
1204520 K swap cache
8388604 K total swap
      0 K used swap
8388604 K free swap
 152134 non-nice user cpu ticks
  30412 nice user cpu ticks
  92840 system cpu ticks
2456112 idle cpu ticks
   2210 IO-wait cpu ticks
      0 stolen cpu ticks
  75410 pages paged in
  63500 pages paged out
      0 pages swapped in
      0 pages swapped out
 152410 interrupts
 248320 context switches
5. Run the command with the -d option to display disk statistics on the server.
vmstat -d
OutPut:
disk- ------------reads------------ ------------writes----------- -----IO------
       total merged sectors      ms   total merged sectors      ms    cur    sec
sda    24510    132  185632    8120   16321    281  210940    5320      0      4
sdb     1210     12   18320     610     532     10    8650     300      0      1
6. Read the manual for further options.
man vmstat
Tracking Active Processes with the PS Command
You can use the ps command to list currently running processes on your Linux server.
1. See active processes in your session with the below command.
ps
Output:
 PID TTY          TIME CMD
1450 pts/0    00:00:00 bash
1525 pts/0    00:00:00 ps
2. In case you want to see all running processes under all users on the whole system, you can use aux option.
ps aux
Output:
USER       PID %CPU %MEM    VSZ   RSS TTY      STAT START   TIME COMMAND
root         1  0.0  0.1 167244  1132 ?        Ss   Sep25   0:03 /sbin/init
root       532  0.0  0.3  72340  3148 ?        Ss   Sep25   0:00 /lib/systemd/systemd-logind
root       550  0.0  0.2  45000  2140 ?        Ss   Sep25   0:00 /usr/sbin/cron -f
root       720  0.1  2.5 272456 25000 ?        Ssl  Sep25   0:20 /usr/bin/dockerd -H fd://
mysql      950  0.5 10.3 1693420 101236 ?      Ssl  Sep25   8:10 /usr/sbin/mysqld
www-data  1100  0.3  5.2 398320 50528 ?        S    Sep25   5:42 /usr/sbin/apache2 -k start
www-data  1102  0.2  4.8 400452 46528 ?        S    Sep25   4:30 /usr/sbin/apache2 -k start
user1     1420  0.0  0.6  18420  6128 pts/0    Ss   11:01   0:00 -bash
user1     1685  0.0  0.3  36920  3240 pts/0    R+   11:02   0:00 ps aux
The output includes:
- PID = Process ID of the task.
- USER = user who started the process.
- %CPU = percentage of CPU the process is using.
- %MEM = percentage of memory the process is using.
- COMMAND = The name of the command running the process.
3. You can sort processes by memory usage with –-
ps aux --sort=-%mem
This will list processes sorted by the highest memory consumption. You can replace %mem with %cpu if you need to sort by CPU usage.
4. To see processes started by a particular user with the command.
ps -u username
5. For a more detailed view of a process, use the -f option.
ps -f
6. Explore more options in the manual.
man ps
Using Htop for an Interactive View of System Processes
Htop is a better alternative to the top command because it provides an easy-to-read interface with color-coded details. Check out the below commands to see how you can use it.
1. Installation command
- Htop on Debian/Ubuntu:
sudo apt install htop
- Htop on CentOS/RHEL-based systems:
sudo dnf install htop
2. View the Htop version currently installed.
htop --version
Output:
htop 3.2.2
The htop interface displays:
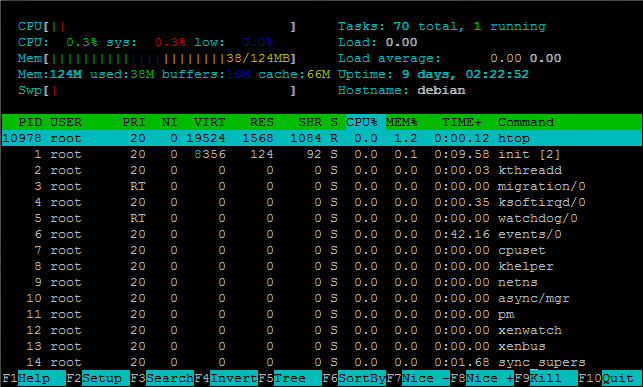
CPU: A real-time graph of CPU usage.Memory: RAM and swap memory usage.Process List: All running processes with details like PID, user, CPU, and memory usage.- Navigate through the interface using arrow keys.
- To exit, press Q.
3. You can get a tree view to see process hierarchies.
htop -t
4. Check the manual for more options.
man htop
Checking Open Files with the Lsof Command
The lsof command lists all open files and the processes using them.
1. See all open files with the below command.
sudo lsof
The output includes:
COMMAND     PID     USER   FD      TYPE DEVICE SIZE/OFF    NODE NAME
systemd       1     root  cwd       DIR  253,0     4096       2 /
systemd       1     root  rtd       DIR  253,0     4096       2 /
systemd       1     root  txt       REG  253,0 1710440  131104 /usr/lib/systemd/systemd
systemd       1     root  mem       REG  253,0  185008  131241 /usr/lib/x86_64-linux-gnu/libz.so.1.2.13
COMMAND: name of the process using the file.PID: process ID.USER: owner of the process.FD: The file descriptor type (e.g., read, write).NAME: The file path.
2. Check which files are open in a specific directory.
sudo lsof /
3. Check files opened by a specific user.
sudo lsof -u username
Output:
COMMAND   PID   USER   FD      TYPE DEVICE SIZE/OFF    NODE NAME
bash     2134 ubuntu  cwd       DIR  253,0     4096  524321 /home/ubuntu
bash     2134 ubuntu  rtd       DIR  253,0     4096       2 /
bash     2134 ubuntu  txt       REG  253,0 1268776  132201 /usr/bin/bash
ssh      2201 ubuntu  cwd       DIR  253,0     4096  524321 /home/ubuntu
ssh      2201 ubuntu  rtd       DIR  253,0     4096       2 /
ssh      2201 ubuntu  txt       REG  253,0  755376  131876 /usr/bin/ssh
4. You can find processes using HTTP port 80.
sudo lsof -i :80
5. Find which files a program like Apache is using –
sudo lsof /usr/sbin/apache2
Output:
COMMAND   PID USER   FD   TYPE DEVICE SIZE/OFF   NODE NAME
apache2  1543 root  txt    REG  253,0 4871648  78669 /usr/sbin/apache2
apache2  1545 www-data txt REG  253,0 4871648  78669 /usr/sbin/apache2
apache2  1546 www-data txt REG  253,0 4871648  78669 /usr/sbin/apache2
6. Check the manual with the below command.
man lsof
Monitoring Disk Activity with Iotop
The iotop command helps track disk input and output (I/O) activities.
1. Install iotop
- On Debian/Ubuntu server.
sudo apt install iotop
- CentOS/RHEL-based systems
sudo dnf install iotop
2. Confirm the current version of iotop.
sudo iotop --version
Output:
iotop 0.6
3. Start monitoring disk activity.
sudo iotop
The output includes:
Total DISK READ: 0.00 B/s | Total DISK WRITE: 0.00 B/s
TID  PRIO  USER     DISK READ  DISK WRITE  SWAPIN     IO>    COMMAND
12   be/4  root     0.00 B/s   0.00 B/s    0.00 %   0.10 %  [jbd2/sda1-8]
14   be/4  mysql    0.00 B/s   2.30 K/s    0.00 %   0.05 %  mysqld --basedir=/usr
16   be/4  www-data 0.00 B/s   1.15 K/s    0.00 %   0.02 %  apache2 -k start
19   be/4  root     0.00 B/s   0.00 B/s    0.00 %   0.00 %  [kworker/0:1H]
TID: thread ID of the process.USER: user who started the process.DISK READ: amount of data read from disk.DISK WRITE: amount of data written to disk.COMMAND: name of the running process.
4. View only active processes performing disk operations.
sudo iotop -o
5. Include a timestamp in the output.
sudo iotop -t
6. Monitor disk usage for a specific user.
sudo iotop -u username
Output:
Total DISK READ: 0.00 B/s | Total DISK WRITE: 3.45 K/s
TID  PRIO  USER      DISK READ  DISK WRITE  SWAPIN     IO>    COMMAND
2456 be/4  ubuntu    0.00 B/s   2.30 K/s    0.00 %   0.10 %  python3 app.py
2678 be/4  ubuntu    0.00 B/s   1.15 K/s    0.00 %   0.05 %  node server.js
7. Check the manual for further customization.
man iotop
Checking Server Uptime and Kernel Messages
1. The below uptime command helps see how long your server has been running.
uptime
The output includes:
14:32:41 up 5 days, 3:17, 3 users, load average: 0.12, 0.08, 0.05
- Current Time:
14:32:41 - Uptime Duration:
5 days, 3 hours, 17 minutes - Logged-in Users:
3 users - Load Average:
0.12 (1 min), 0.08 (5 min), 0.05 (15 min)
2. See uptime in hours and minutes with the following command –
uptime -p
Output:
up 5 days, 3 hours, 17 minutes
3. Check when the server was last rebooted with –
uptime -s
Output:
2025-09-15 08:42:13
Strace Command to Trace System Calls
When debugging or analyzing a program. The strace command helps track these calls in real time. It troubleshoots performance or debugging errors.
- Install
straceon Debian or Ubuntu.
sudo apt install strace
- For CentOS or RHEL-based systems:
sudo dnf install strace
- Trace a specific command.
sudo strace command_name
- For example, trace Apache using.
sudo strace apache2
The output will show system calls made by the process.
mmap(NULL, 8192, PROT_READ|PROT_WRITE, MAP_PRIVATE|MAP_ANONYMOUS, -1, 0) = 0x7f3a8e4c9000
mmap(NULL, 123456, PROT_READ, MAP_PRIVATE, 3, 0) = 0x7f3a8e4ab000
openat(AT_FDCWD, "/lib/x86_64-linux-gnu/libpcre.so.3", O_RDONLY|O_CLOEXEC) = 3
socket(AF_INET6, SOCK_STREAM, IPPROTO_TCP) = 6
bind(6, {sa_family=AF_INET6, sin6_port=htons(80), ...}, 28) = 0
listen(6, 511)                          = 0
rt_sigaction(SIGTERM, {sa_handler=0x55a2f77a1b30, sa_mask=[], sa_flags=SA_RESTORER|SA_RESTART, sa_restorer=0x7f3a8e10d6a0}, NULL, 8) = 0
- Trace a running process by its Process ID (PID)
sudo strace -p 1234
Replace 1234 with the actual PID of the process you want to monitor.
For more details, check the manual:
- Check the manual and get more details.
man strace
Conclusion
Use the right commands and tools to optimize your server and avoid unexpected failures. Always refer to manual pages for detailed options and keep tracking server usage for better efficiency.