How to Check the Resource Usage in cPanel?
How may I check resource usage in cPanel?
Did you know you can check your website’s current resource usage? If you would like to know, then we can check how.
Resource Usage can shed light on how to do this. Resource Usage is a resource monitoring service available to you that you can use to view detailed information regarding processes running on your account that are consuming the most resources. This information can help you understand why you are receiving the resource limit trigger.
Depending on the resource usage of your account, you may see the following summary displayed on the Overview page of Resource Usage:
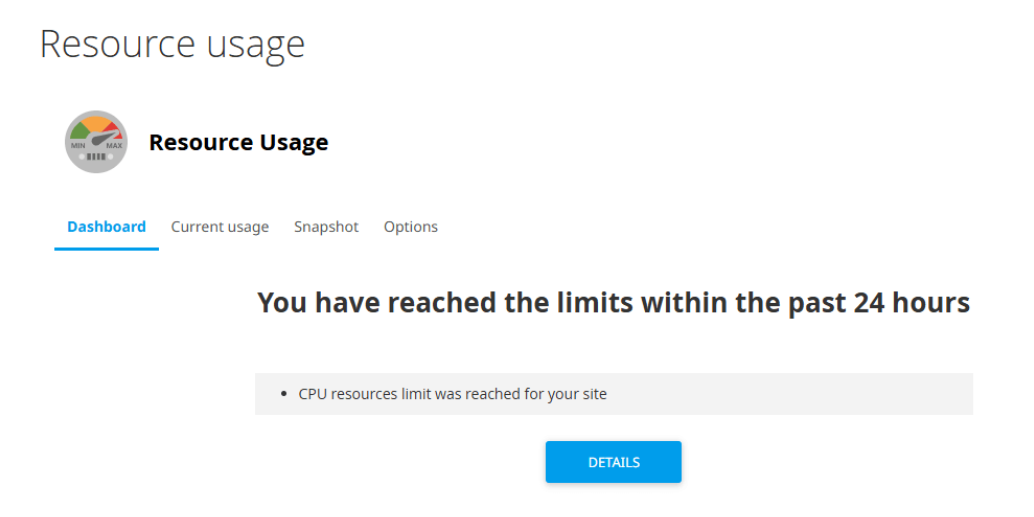
If your site has been resource constrained in the last 24 hours, the following message is displayed:
This indicates that your account has triggered at least one resource limit in the last 24 hours. More information regarding which resources triggered the limit is available in cPanel.
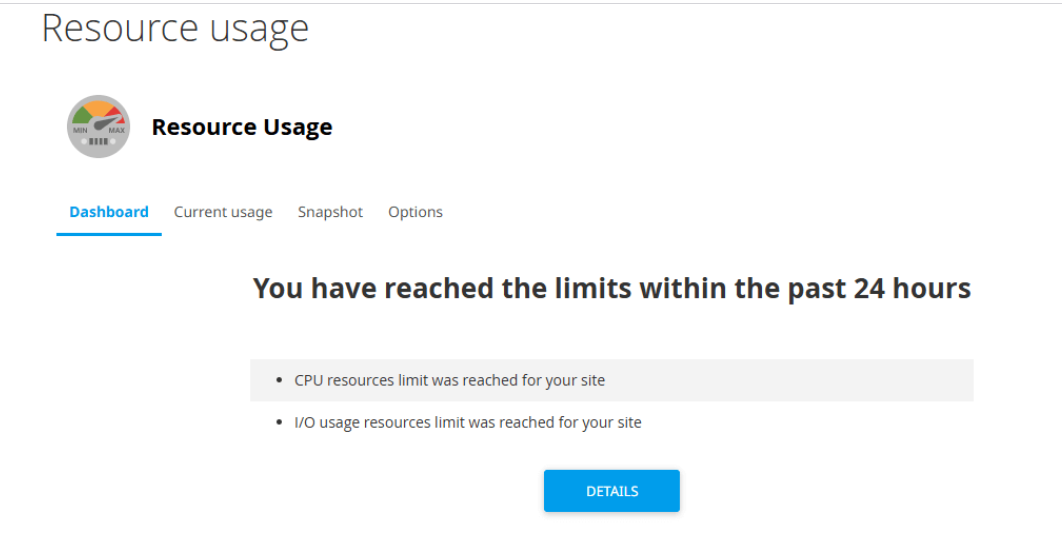
If your site is likely to hit resource limits soon, the following message will be displayed:
This is a warning message that your account is likely to hit the resource limit soon. More information regarding which resource is likely to exceed the limit is available in cPanel.
To check detailed resource usage information, please follow the steps below.
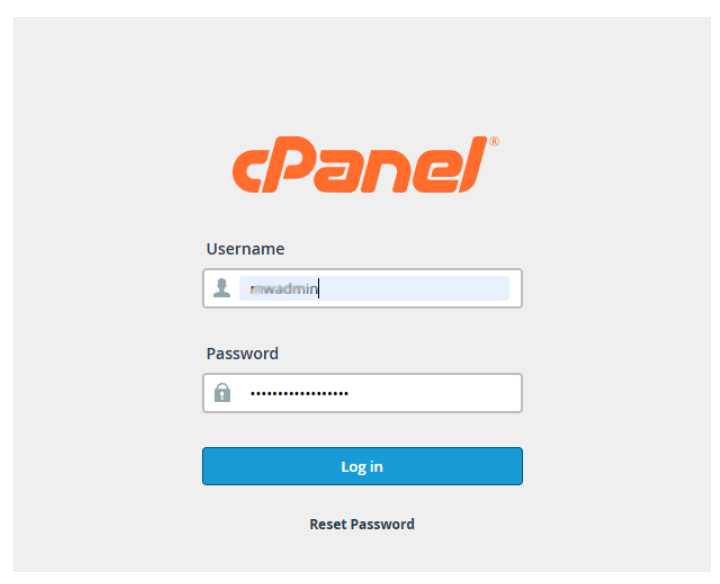
Log into your cPanel account
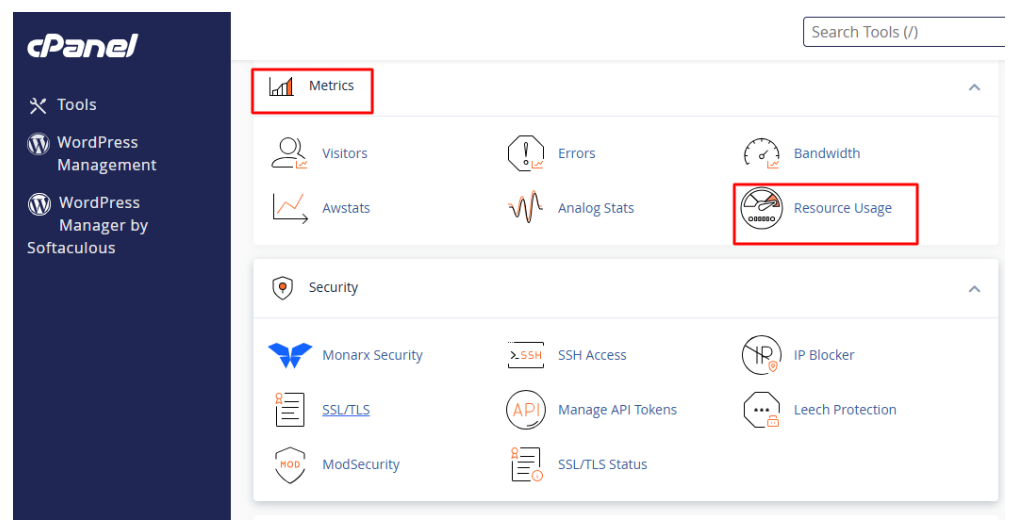
Subsequently, select Metrics, then Resource Usage under Metrics section
- The Resources Usage Overview page shows your account’s status. Click on Details for further explanation.
- The resource usage data will be shown in graphs and tables.
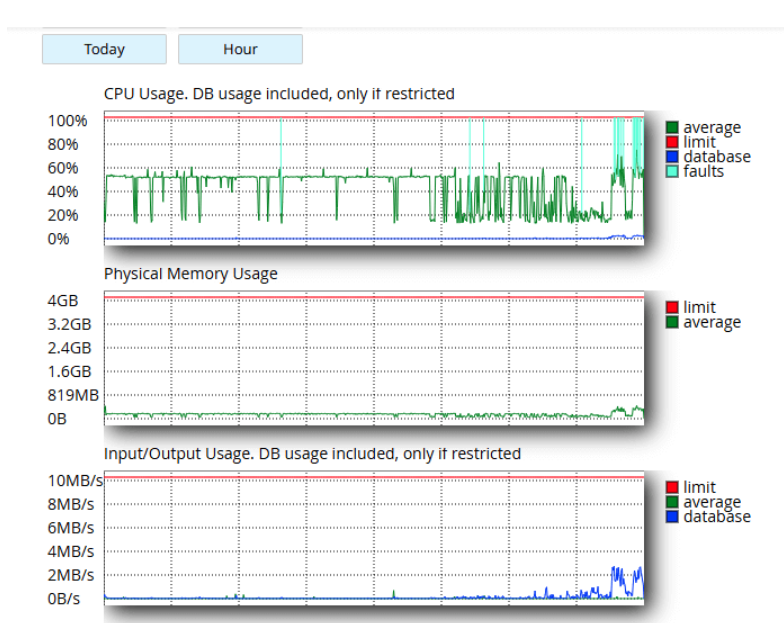
Clarifying the Terminology in Current Usage Stats
CPU Usage
CPU usage reflects the proportion of the CPU resources your account is currently utilizing out of the total resources allocated. When your account shows CPU usage at 100%, it indicates your account is consuming all the available CPU resources, and if there are new processes to be executed, they will go into a queue until the ongoing processes finish. This can cause your website to slow down significantly and may time out
Inodes Usage
This is a file accounting system. It keeps track of what items you have on your disk space. It is a certain set of information around a file or folder (e.g. size, owner, etc. without filename and content data), which takes up a space at a table of your disk. The more files/folders you have in your account, the more inodes\/records you are using, thus the more system resources your account is consuming. The more inodes you have, the more your account is being used. Eventually, your account will have problems such as being unable to upload files, backup data on your website properly, receive emails, and establish a proper connection without errors on your website, and more.
Tips to reduce the amount of inodes in your account
The number of inodes used in your account is the amount of files and folders in your account. Hence, in order to reduce the amount of inodes, you have to reduce the number of files and folders in your account on your hosting account. The easiest way to do this is to delete unnecessary folders and files.
I/O Usage (Input/Output)
This portion of disk activity measures the I/O usage that your account incurs. Quite literally, it is the rate at which data is transferred from RAM to your hard disk. With each instance of data usage on the server disk, be it from reading or writing to the server, you incur usage of that tier. Websites that have a lot of media or websites that have a lot of data in databases tend to have a lot of I/O usage. If your account is near the I/O limit, you will not see errors on your account. Instead, your account will just stay frozen while it tries to transfer the needed data from your hard disk to RAM.
IOPS
IOPS is the acronym for the term “Input/Output Operations Per Second.” IOPS indicates the maximum number of operations a drive can read or write in a given second. Once the limit is reached, there will be a pause in the read/write operations till that second is finished.
Entry Processes
This shows how many PHP, CGI, etc. scripts will be run simultaneously. Keep in mind, however, that this will not match the number of visitors your site can have at once. Typically speaking, an “Entry Process” only takes a second to complete. For instance, if your site runs on WordPress (which is written in PHP), each time a user goes to your site, the server will perform a process of them making a page request and that will be one process. Once the user gets your site to load in their browser, that is no longer a process and the user will have to perform an action to reprocess. Alternatively, if the user were to load a different page on your site, that would be a process as well.
Amount of Processes
It reflects the number of concurrent processes running for your account. This number covers all the processes created by your account.
Physical RAM Usage
Physical RAM (Random Access Memory) Usage indicates the amount of memory that has been provisioned for your account.
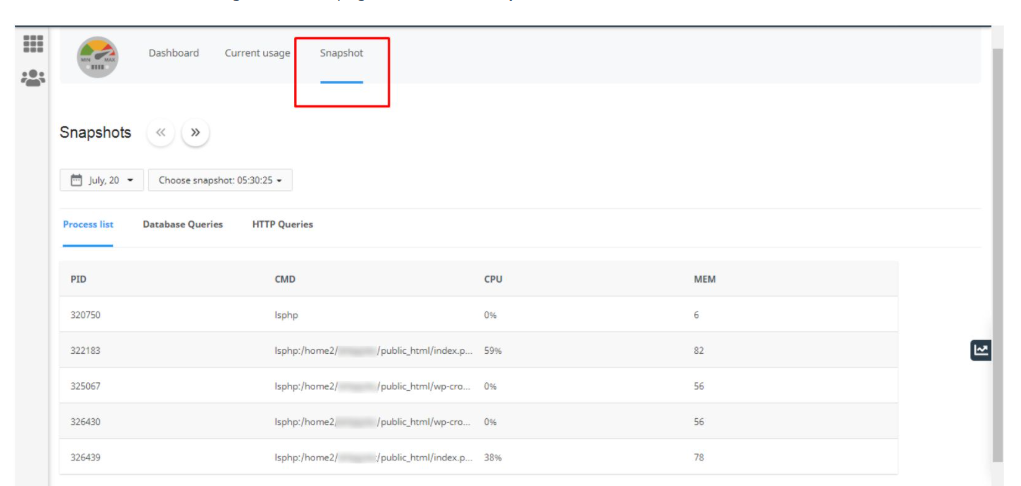
Analyzing the Resource Usage Snapshots
Snapshots help identify the reasons for your account reaching its limits.
Find the Resource Usage Overview page and click Snapshots.
From the calendar, select the date for which you want to see the snapshots.
In the Choose Snapshot dropdown, for the particular time you want to view, select the snapshot.
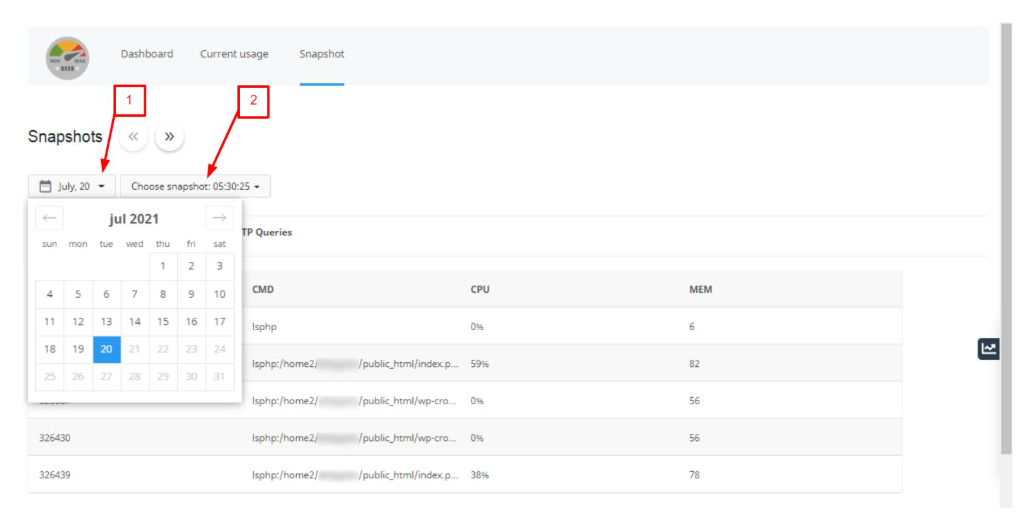
To see the previous and next snapshots, you can use the Previous Snapshot and Next Snapshot links.
Conclusion
Monitoring usage statistics in cPanel Hosting Resource Usage is one of the essential proactive tasks in sustaining a high-functioning website. By monitoring the CPU, Memory, Entry Processes, and I/O usage, the user can stay ahead of the issues and troubleshoot optimally before the user is affected and/or before the website hits the service limitations set by the hosting provider. Knowing which limitations are being hit allows the user to make informed choices, such as optimizing database queries, updating code that is inefficient, or to simply update the hosting plan to allow the site to be accessible, functional, and reliable to all visitors.